Report Sections
Night Summary reports are built from several sections, each providing different information about your imaging session. This page explains what each section shows and which detail level is required.
Header
Always shown.
The report header includes:
- Session date and times — start time, end time (or “In Progress” if the session is still running), and total duration in hours
- Profile name — the active NINA equipment profile
- Equipment profile — a collapsible section listing all connected equipment (camera, telescope, mount, etc.). See Equipment Profile for details.
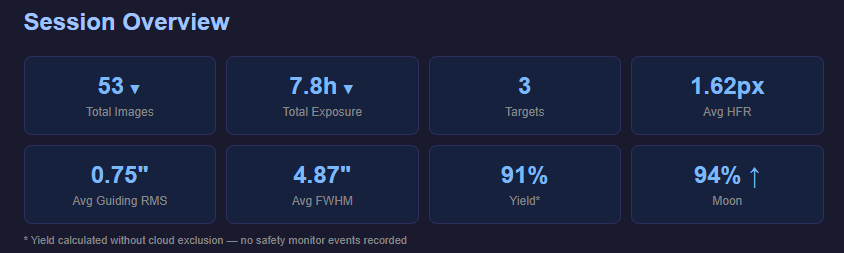
Session Overview (Stat Boxes)
Always shown. Additional stats appear at higher detail levels.
A row of summary stat boxes showing key metrics at a glance:
| Stat | Detail Level | Description |
|---|---|---|
| Total Images | All | Number of captured exposures, with per-filter breakdown on click. Shows aborted count if any. |
| Total Exposure | All | Cumulative exposure time, with per-filter breakdown on click |
| Targets | All | Number of distinct targets imaged |
| Avg HFR | Standard+ | Average half-flux radius across all images (pixels) |
| Avg Guiding RMS | Standard+ | Average guiding RMS total across all images (arcsec) |
| Avg FWHM | Full | Average full-width at half-maximum (arcsec). Requires the Hocus Focus plugin. |
| Yield | Full | Percentage of imaging window spent actually exposing. If a safety monitor is connected, roof-closed time is excluded. |
| Moon | Full | Moon illumination percentage with waxing/waning arrow |
The Total Images and Total Exposure boxes are expandable — click to see the per-filter breakdown.
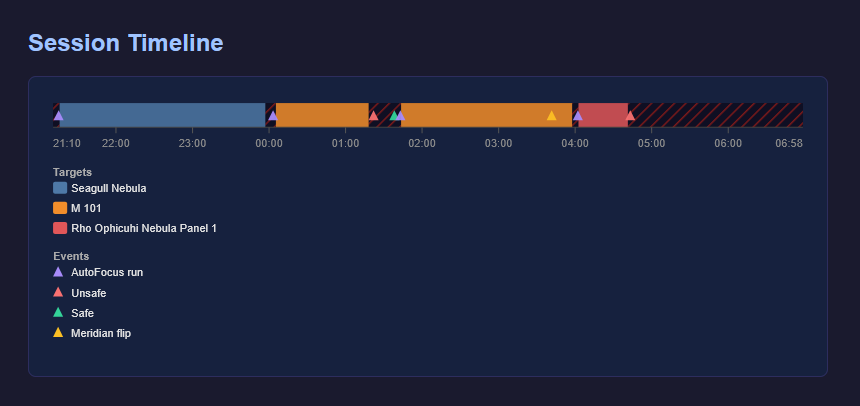
Event Timeline
Standard and Full detail levels.
A visual timeline showing what happened during your session in chronological order. Events include sequence start/end, target changes, autofocus runs, meridian flips, and safety monitor events (roof open/close).
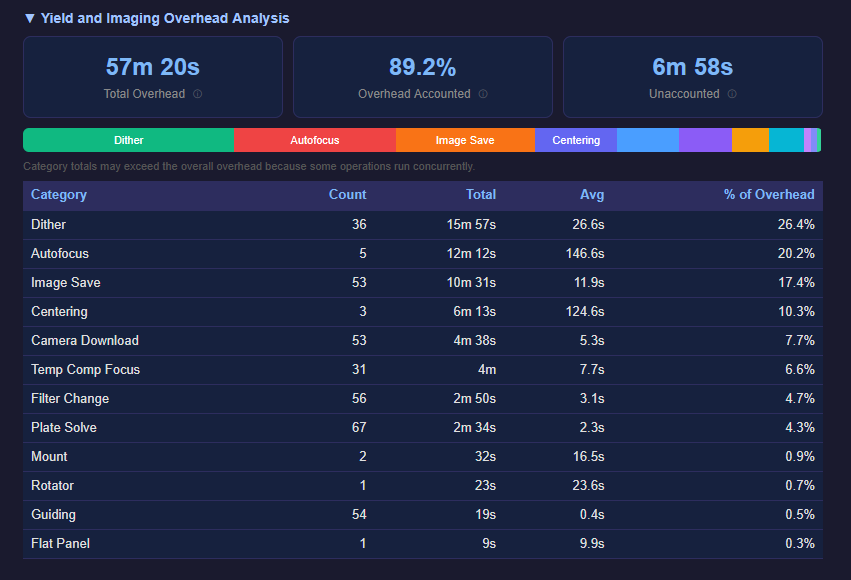
Yield and Imaging Overhead Analysis
Full detail level only. See Yield and Overhead Analysis for a deep dive.
Parses your NINA log file to show exactly where non-imaging time was spent. Includes:
- Summary stat boxes — total overhead time, percentage of overhead accounted for, and unaccounted time
- Stacked bar chart — color-coded horizontal bar showing the relative proportion of each overhead category
- Detailed table — each category with event count, total time, and average time per event
Categories include camera download, filter changes, dithering, autofocus, plate solves, centering, image saves, temperature compensation focus, meridian flips, and more.
Target Details
Always shown. Content varies by detail level and available data.
For each target imaged during the session:
Target Header
- Target name
- Coordinates (RA/Dec)
- FOV sky rotation angle
- Session time window (first to last image)
- Moon separation angle
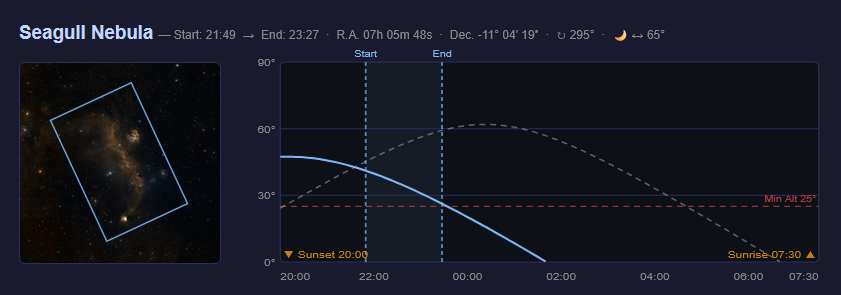
Sky Thumbnail
A sky survey image showing where the target is located, with an FOV (field of view) rectangle overlay showing your camera’s framing and rotation. The thumbnail is fetched from the CDS HiPS2FITS color survey. If CDS is unavailable, Night Summary falls back to NASA SkyView DSS2 Red (monochrome). If both services are down, a remote CDS URL is embedded so the browser can fetch it directly when you view the report. Controlled by the Show Sky Thumbnails setting.
Altitude Chart (Standard+)
An SVG altitude plot showing the target’s path across the sky during the session, with markers for each exposure. Optionally includes:
- Moon curve — moon altitude shown as a dashed line
- Minimum altitude line — dotted red line at the Target Scheduler project’s minimum altitude (requires Target Scheduler)
Live Stack Images
Thumbnails captured from the Live Stack plugin during the session. See Live Stack Integration.
Filter Table
A table showing per-filter statistics: filter name, image count, individual exposure time, and total time.
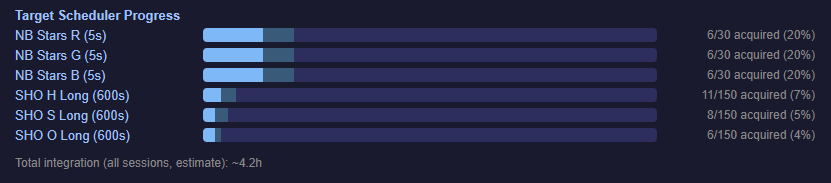
Target Scheduler Progress Bars (Standard+)
Per-filter acquisition progress when Target Scheduler is installed. Shows accepted vs. acquired frames against the plan’s desired total. See Target Scheduler Integration.
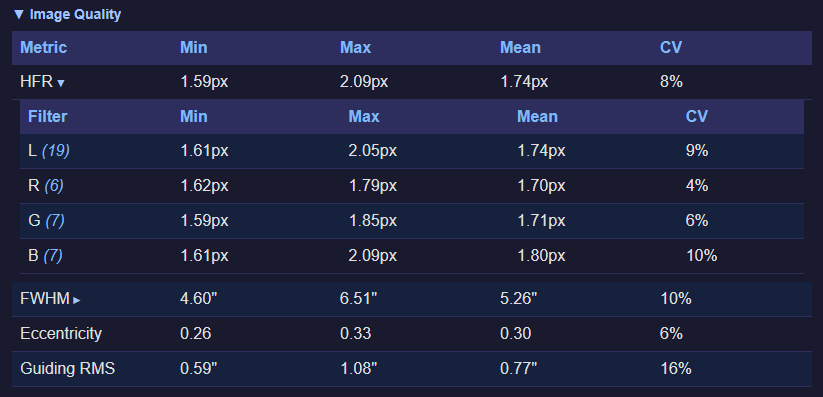
Per-Target Image Quality (Standard+)
Expandable table showing HFR, FWHM, Eccentricity, and Guiding RMS with min/max/mean/CV for the target. Click to expand individual rows for per-filter breakdowns.
Session History (Full)
Cumulative integration time for the target across all recorded sessions — not just tonight.
Image Quality Section
Standard and Full detail levels.
A session-wide image quality summary with:
- Star Count CV — coefficient of variation of star counts across the session, with a per-filter breakdown table. Useful for detecting cloud passages or other consistency issues. You can configure filter classifications to group broadband and narrowband separately.
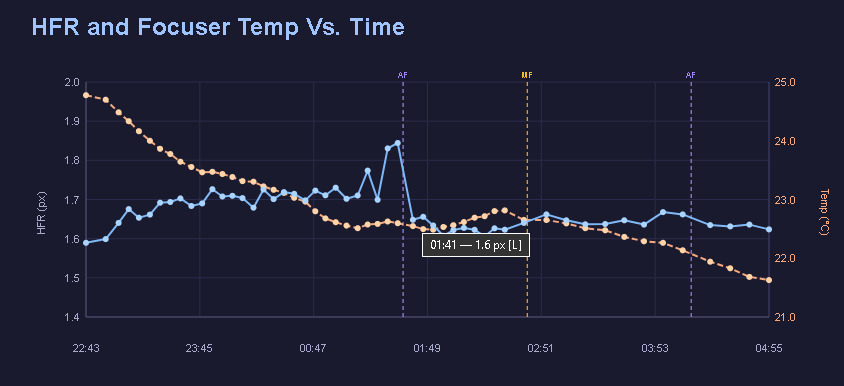
- Metric Chart (Full) — customizable chart with up to three metrics: a primary and secondary Y-axis metric, plus the X-axis can be set to any metric (not just time). See Metric Charts.
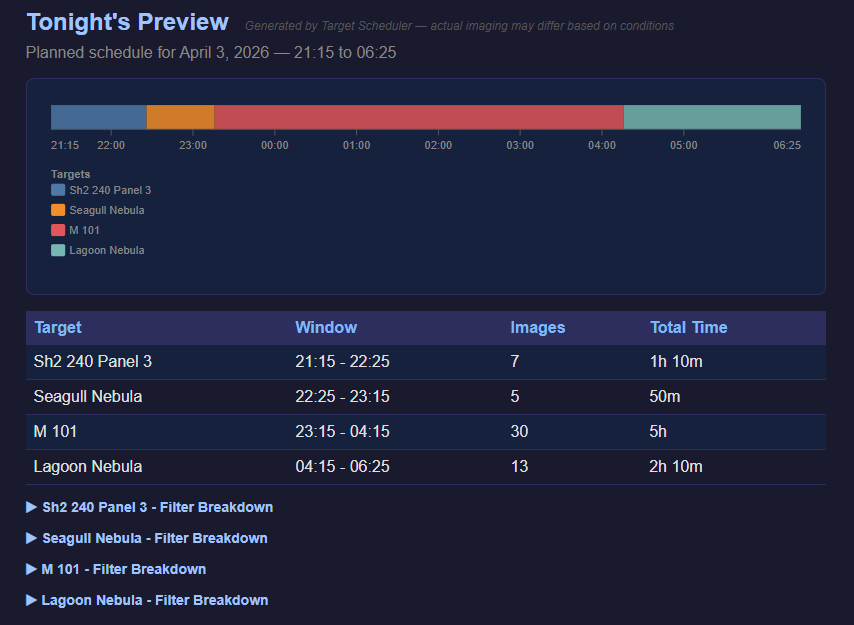
Tonight’s Preview
Full detail level only. Requires Target Scheduler with its API enabled.
Shows what Target Scheduler plans to image tonight — target names, planned exposure times, and filter sequences. Useful for reviewing the upcoming session. See Target Scheduler Integration.
Footer
Always shown.
Shows the plugin version, NINA version, and author credit.